+44 7979 187323 +44 1905 723568
LabVIEW Multiplot Master Toolkit

LabVIEW – Multiplot Master Toolkit

Have you ever had this problem?

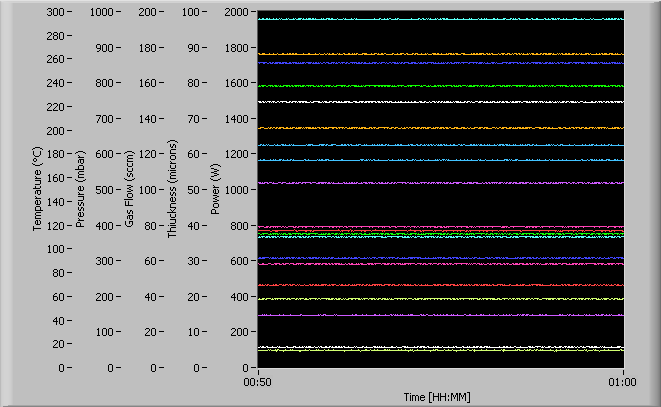
It’s confusing isn’t it? 

LabVIEW Multiplot Master Toolkit gives you 3 much better ways of plotting and comparing many signals with different units and ranges – plus a range of other tools.


Download LabVIEW Multiplot Master Toolkit

3 Intuitive Options to Plot your Data

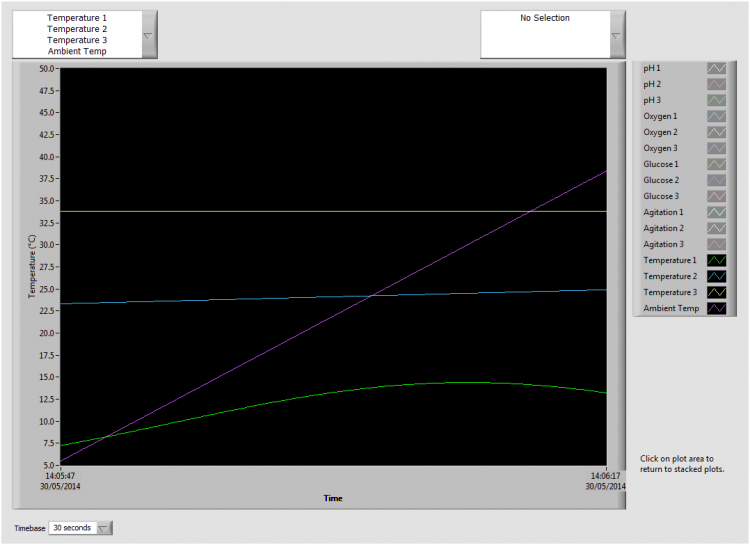
One of these 3 chart formats is shown below.  

An intuitive configuration screen allows you to divide you plots into groups and then the 2 drop-down menus above the chart allow you to display either 1 or 2 groups at a time.  For this particular format, clicking on the plot area allows you to toggle between this format and a stacked plot chart that shows all you plots with one plot group in each plot area.

Toolkit Features

  • Works with waveform charts, waveform graphs and XY graphs.
  • Offers 3 different intuitive ways of plotting your data.
  • Includes screens for easy configuration of your graphs/charts.
  • Works with LabVIEW 2011 and later.
  • Use over and over again in different programs.
  • Saves weeks of programming.
  • Available for a 30-day evaluation.
  • LiveWires can supply modifications if it is not exactly what you need.

Download your copy now from the Download LabVIEW Multiplot Master Toolkit


Multiplot Master - LabVIEW Tools Network


If you have any questions please contact us.

Let's talk about your next project